Wednesday, November 6, 2013

Method for Analyzing the Value of Distributed Energy Storage at the Facility Level – Step 1b: Electricity Issues

Figure 1 of the previous post (Step1a: Current Energy Needs) shows the current step in the evaluation methodology. After understanding the current electricity consumption at the facility the next step is to understand if there are any adverse conditions, with regards to energy consumption, that could be rectified by deploying energy storage at the facility. Understanding the energy needs at the facility and any electricity issues experienced at the facility, is critical to selecting the energy storage application that would be most profitable at the facility. Understanding the most appropriate energy storage application will, in turn, help to select the most correct energy storage device.

When I first performed this analysis, the facility in question housed a software company. Interestingly, though they were charged a considerable demand charge on their electricity bills they did not pay a different rate for their peak energy consumption vs their off peak consumption. It should be noted that this uniform energy billing was very uncommon in the area. The facility also experienced a statistically anomalous lack of power quality events (especially when compared to previous facilities that housed the same company). Another important element, is that the facility did not deploy onsite renewable energy generation.

Without a difference in Peak vs. Off-Peak billing, utilizing energy storage for the Time of Use (TOU) Energy Cost Management application would be of little value at the facility. Without significant power quality events, power quality applications of energy storage were also of little value. Clearly without on-site renewable energy deployment, the application of energy storage to smooth out variability in renewable energy generation was also not important. At this facility, in its current state, only Demand Charge Management had the potential to be a valuable additional energy storage application.

I say additional energy storage application because as a software company, the facility housed several server rooms which demanded 100% reliability. Even though the grid supplied electricity was considered highly reliable, this demand for 100% reliability required that backup diesel generators be deployed. These generators could produce electricity almost indefinitely (provided a constant supply of diesel fuel) but they had a start-up time of roughly 15 seconds. To ride through the time between a blackout from the utility and the availability of electricity from the backup generators the facility used energy storage in the form of six flywheels in a blackout application.


With an understanding of both the energy needs and energy issues at the facility one can understand the most appropriate applications of energy storage at a facility. Understanding the appropriate application is the first qualifying step for selecting an energy storage device that is appropriate for the facility. Next we will look at other things that must be considered to select an appropriate energy storage device so that the device can be evaluated to understand the value of its deployment at the facility level.

Tuesday, November 5, 2013

Method for Analyzing the Value of Distributed Energy Storage at the Facility Level – Step 1a: Current Energy Needs

Figure 1 shows the current step in the evaluation methodology…

Figure 1 Showing the current first step in the methodology for evaluating a facility level energy storage deployment.

The first step in evaluating a facility level energy storage deployment is to understand:
  • The current power and energy consumption at the facility
  • Any issues related to electricity currently experienced at the facility

For a first pass analysis, understanding the current power and energy consumption at the facility can usually be done by reviewing utility bills for the facility. Clearly the larger the interval of time for these utility bills, the better. One year of utility bills will provide some insight to seasonal variation in energy consumption and should be considered the minimum interval. Longer intervals would cover significant, sometimes one time, changes in the facility or trends that span multiple years.

In reviewing the electricity bills it is important to understand the different components of the bill. These components, which are often not seen in a household electric bill, result from  the relatively large power and energy requirements of many facilities. These components also reflect the utility’s desire to incentivize facilities towards the most profitable, ideal and efficient scenario for a grid utility: the (currently unrealistic) ideal where electric demand remains constant with no variation. Utilities employ two components (or billing schemes) for larger, business customers in an attempt to discourage unpredictable consumption with significant time wise variation in power demand. These components include:
  1. Demand Charge - measured in units of $/kW, the demand charge is assessed by the highest demand of a customer (kW) in any 15 minute (or sometimes one hour) interval during a monthly billing cycle (NSTAR, 2013) & (Baxter, 2012). This charge is levied even if there is only one such interval in the billing cycle. In many instances, the demand charge ($/kW) will rival the consumption charge ($/kWh) applied during a billing cycle. Clearly the demand charge is meant to provide an incentive for the facility to avoid large, disruptive spikes in their power consumption. A utility must maintain large, costly power generation assets that are often unused, spinning or idle in anticipation of power spikes. It is important to note that the application of a demand charge is made possible through constant (or short interval) metering of the facility’s electricity demand. This constant metering is a unique characteristic of a large consuming facility’s electric bill. It provides a high level of granularity (uncommon in household bills) that facilitates analysis.
  2. Peak/Off-Peak Energy  - The second component is to charge more for electricity consumed when demand is highest (i.e. the peak period) than the time period when demand is lowest (i.e. off peak period). The billing rates for peak and off-peak consumption are in units of $/kWh. The daily start and end time of the peak period varies from region to region, but they usually cover normal daytime business operating hours (when demand is highest)  (NSTAR, 2013).


An annual load profile for  a facility might look something like Figure 2. Looking at Figure 2, for this particular load profile, one can see seasonal variation in electricity consumption with a summertime peak for cooling and a smaller wintertime peak resulting from electrical equipment being engaged to support natural gas fired heating. One can also see a weekly consumption pattern where a lack of occupancy and a forced roll back of equipment on weekends significantly reduces demand.

Figure 2 showing the peak minimum power consumption (KW) of a facility.

In this first pass analysis, the current load profile (KW and kWh over time) will serve as the baseline for measuring the changes predicted by deploying energy storage at the facility level. At this very early stage, one application of energy storage stands out has having great potential for a facility level deployment. That application is the behind the meter application of Demand Charge Management.

Works Cited

Baxter, R. (2012, November 28). Author, Energy Storage; a Nontechnical Guide. (M. Banta, Interviewer)

NSTAR. (2013). Billing Rights. Retrieved January 21, 2013, from NSTAR: http://www.nstar.com/residential/customer_information/billing_rights.asp


Tuesday, October 29, 2013

Method for Analyzing the Value of Distributed Energy Storage at the Facility Level - Introduction

There are a very wide array of energy storage devices in production or in development. Many devices are developed with a focus on the centralized utility model where grid scale energy production is supported or augmented with grid scale energy storage. On the opposite side of the spectrum are small scale energy storage devices, most commonly meant to support small, household, island renewable energy installations (commonly Solar PV). Certainly there is great potential in both of these markets, but I feel that there is also great potential in a distributed energy storage model where individual facilities (office buildings, factories, schools, etc…) deploy energy storage devices to their advantage. I believe three factors will add pressure to accelerate development in this area:


1.      A (hopefully significant) continuation of the downward trend of distributed scale energy storage devices.
2.      An increasing demand for high quality, stable and reliable electricity to support increasingly sophisticated equipment.
3.      An increase in the price that utilities charge these facilities for the facility’s peak power consumption.

The highest priority for facilities managers is to meet the occupant’s energy and work environment requirements to help achieve optimal productivity. Often, many other considerations such as cost and sustainability take a backseat to maintaining productivity. The methodology that I propose below is meant to allow a facilities manager or a sustainability officer to quickly evaluate the appropriateness and value of deploying an energy storage device. This methodology considers the costs and benefits of only deploying energy storage at the facility, later postings will expand this methodology to consider combining distributed renewable energy generation with the energy storage device.

Figure 1 shows an outline of the methodology to be used as a “first pass” analysis to estimate the value of distributed energy storage at the facility level. The methodology below will consider three methods of energy storage: distributed scale Compressed Air Energy Storage (CAES), vanadium redox batteries and thermal energy storage. Each subsequent post in this series will review one additional step in the methodology. I very much hope that people comment on each step to help refine the methodology.


Figure 1 showing an outline of the methodology for evaluating a facility level energy storage deployment.

Wednesday, October 23, 2013

A Case for Energy Storage

        The world finds itself at the confluence of many forces that, if unattended, will compromise our ability to generate affordable and continuous electric energy. Any serious degradation in our electricity supply would cut the lifeblood out of our technology dependent modern way of life. One force is supply; conventional means of power generation are heavily supply constrained. Peak oil is predicted within the next few decades, natural gas and coal have reserves predicted to run out in the next century and uranium is predicted to only be able to meet current demand for another 70 years (Gallagher, 2010) & (Zittel & Schindler, 2006). The second force is environmental degradation; fossil fuels and nuclear power impact our environment in ways that could severely compromise the earth’s ability to support life. Lastly, a third force is the strong desire to maintain the current levels of reliability in the supply of electricity. The current US electric grid, the very backbone of our modern electrified life, is considered antiquated and likely to experience more frequent, massive and costly failures. It is also considered ill-equipped to meet current demand and unable to accommodate new sources of energy (Timmer, 2009). For our modern life to be sustainable and environmentally friendly, renewable energy must be integrated into a modern, capable electricity delivery system.
It is easy to assert that solar driven renewable sources of energy, such as solar photovoltaic (PV) and wind energy, can solve many of the problems that plague modern electricity production. From providing environmental benefits to removing the impetus behind marred, sometimes violent, US foreign relations, the many benefits of wide spread renewable adoption are well known. In spite of the great promise of solar driven renewables, in 2011, only .2% and 1.5% of US primary energy production came from solar PV and wind energy, respectively. In total less than 12% of US primary energy came from any form of energy that is considered renewable; including hydropower and biomass combustion (U.S. EIA, 2012).
There are clearly significant and powerful factors, beyond simple inertia, that explain the difference between an idealized vision of renewable adoption and the slow, albeit accelerating, current realized rate of adoption. Two of these factors are that solar PV and wind energy are not currently considered reliable or viable alternatives to conventional energy production. One way in which these renewables are not viable is that they have not yet fully reached grid parity, i.e. the point where the cost of electricity generated using solar PV or wind is on par with conventional sources of energy (Lorenz, Pinner, & Seitz, 2008). In most areas, as a burgeoning technology, solar PV has a higher average cost/kWh than conventional sources of energy. Considering grid parity, wind energy is further developed with many existing, well sited, wind energy projects achieving parity and a consensus that even “average” wind farms will achieve parity by 2016 (Bloomberg LP, 2011). This lack of across-the-board parity can be attributed to the current low adoption rate of solar PV and wind energy. This low adoption has not yet pushed industry to fully seek the economies of scale that can be realized through mass production and deployment. It is also important to note that, in the US, conventional energy sources enjoy substantial direct and indirect subsidies and relief from the true cost accounting of their many externalities.
               The current electric grid is the largest industrial investment in world history (Schewe, 2006). It is even thought by some to represent the greatest engineering achievement of the 20th century (Wulf, 2000). With its high volume of delivery, the electric grid can be compared to a large retail operation with the exception that historically the electric grid has had no warehousing capability (Huskinson, 2013). For the most part, electricity added to the grid by utility generators must be consumed the instant it is delivered. An excess of supply or demand on the grid can cause serious instability. The responsibilities of utilities that manage the electric grid are predominantly defined by this instantaneous delivery and consumption characteristic of electricity on the grid.
Even with occasional outages, the modern electrical grid is designed to provide a reliable, continuous and seemingly inexhaustible supply of electricity at a moment’s notice. This demand for near 100% reliability brings to light perhaps the most dominant challenge to solar PV and wind energy adoption: the lack of reliability because of intermittency. Solar PV’s intermittency results from its dependency on highly variable solar access (i.e. the sun does not always shine) while wind energy’s intermittency results from its dependency on highly variable wind resources (i.e. the wind doesn’t always blow). This intermittency has put an upper bound of 20% to the amount of a grid's energy that can be currently supplied by solar PV, wind energy and other intermittent sources (APS Panel on Public Affairs, 2010). This 20% upper bound directly corresponds to the upper limits of the variable, rapid response generation capacity of most conventional electric grids.
               The current electric grid, sourced by conventional means of electricity generation, has been designed to provide grid services such as peak demand, base load demand and power quality management. Significant and costly (therefore undesirable) changes to the current grid architecture must be made to directly accommodate intermittent solar PV and wind energy. This need for change to accommodate intermittent renewables also compromises their perceived reliability and viability.
In spite of this, early adopters of renewable generation present a model for leading the market. Some early adopters have implemented large scale, grid-integrated, solar PV arrays and wind farms. Another group of early adopters can be characterized by the implementation of small scale, distributed, grid tied solar PV and wind installations. Some of these distributed installations are off-grid, but most small, distributed installations remain grid tied, when possible, to improve overall reliability. Current electric grids can tolerate only a predefined and relatively small, number of these installations before the intermittency of solar PV and wind generated electricity compromises grid integrity. To compensate for intermittency, conventional generators are often left idling or spinning. For this reason, small scale, distributed, grid tied solar PV and wind energy systems currently, do little to viably reduce the overall amount of required capacity and fuel consumption for conventional electricity generation (Denholm P. , Ela, Kirby, & Milligan, 2010).
In recent years, energy storage has garnered a significant amount of interest as a means of improving conventional grid reliability and for mitigating renewable intermittency. Traditionally, improving the reliability of off-grid solar PV or wind installations involved the storage of electricity through costly lead-acid battery arrays. However the market for both large scale centralized and small distributed energy storage is rapidly expanding and developing. Energy storage encompasses a wide array of technologies promising to benefit all areas of the energy market. Energy storage is seen as the answer to the question of how to bring more and more renewable sources of energy on line while maintaining or improving current standards of electricity reliability. In both the large scale centralized generation model and the small scale distributed (grid-tied or island) generation model energy storage will play a central role in future developments.  

Works Cited

APS Panel on Public Affairs. (2010). Integrating Renewable Electricity on the Grid. Retrieved May 22, 2012, from American Physical Society: http://www.aps.org/policy/reports/popa-reports/upload/integratingelec.pdf

Bloomberg LP. (2011, November 10). Onshore wind energy to reach parity with fossil-fuel electricity by 2016. Retrieved March 9, 2013, from Bloomberg New Energy Finance: http://bnef.com/PressReleases/view/172

Denholm, P., Ela, E., Kirby, B., & Milligan, M. (2010). The Role of energy storage with renewable electricity generation. Las Vegas: NREL.

Gallagher, B. (2010). Peak Oil analyzed with a logistic function and idealized Hubbert curve. Energy Policy, 790-803.

Huskinson, B. (2013, January 11). PhD candidate, Applied Physics; Harvard School of Engineering and Applied Sciences. (M. Banta, Interviewer)

Lorenz, P., Pinner, D., & Seitz, T. (2008). The economics of solar power. The McKinsey Quarterly, 4, 67-79.

Schewe, P. F. (2006). The Grid: A Journey Through the Heart of Our Electrified World. Washington D.C.: Joseph Henry Press.

Timmer, J. (2009, January 19). DOE report paints bleak picture of our electric future. Retrieved from ARS Technica: http://arstechnica.com/tech-policy/2009/01/doe-report-paints-bleak-picture-of-our-electric-future/

U.S. EIA. (2012). Monthly Energy Review. Washington DC: U.S. Department of Energy.

Wulf, W. A. (2000). Great Achievements and Grand Challenges. The Bridge; National Academy of Engineering, 5-11.

Zittel, W., & Schindler, J. (2006). Uranium Resources and Nuclear Energy. Ottobrunn/Aachen: Energy Watch Group.


Tuesday, October 22, 2013

Hydrogen

For many years, hydrogen has captured the public imagination promising to boundlessly fuel modern life with the most common element in the universe. In 1874 Jules Verne postulated that hydrogen, derived from water, "will be the coal of the future.” (Verne, 1918) Most recently George W. Bush proposed launching a new "hydrogen economy" as a method to reduce dependence on foreign oil (Zubrin, 2007). Hydrogen is often referred to as a fuel when it should more appropriately be labeled a means of energy storage. There are many energy-intensive and inefficient methods of hydrogen production including water electrolysis and steam reformation of natural gas. Once hydrogen is acquired it can be used as a combustible, transportable fuel or it can be used to power electricity through fuel cells. One very appealing aspect of using hydrogen for heat or electricity is that the only combustion exhaust is pure water (Romm , 2004). Similar to a fossil fuel powered electricity generator, the amount of power of a hydrogen energy storage system is a function of the generation equipment while the energy is a function of the amount of available hydrogen.
Though there is great potential in hydrogen energy storage, there are many challenges that currently reduce the competitiveness of hydrogen energy storage compared to other energy storage technologies. The current overall efficiency of a hydrogen energy storage system is quite low compared to other storage systems. Whether used for combustion or to drive a fuel cell, the overall efficiency is estimated to be between 21% and 43% (Anscombe , 2012). Though there are safety concerns with hydrogen, they are on par with the safety concerns of traditional fuels, such as gasoline and natural gas. There is additional concern however, because recent studies indicate that pure hydrogen, at levels beyond its natural state, may cause stratospheric disruption (Jacobson & Golden, 2004). Infrastructure changes must also be made to significantly integrate hydrogen as a means of energy storage. With all these concerns, especially the low overall efficiency, hydrogen often is not currently considered a viable means of energy storage on any scale.
In the energy storage industry change is everywhere and future innovations could make hydrogen much more appealing. Another thing to consider is that the low overall efficiency of hydrogen is a significant concern given current methods of electricity generation. These generation methods include fossil fuel based generation (oil, coal and natural gas) and nuclear power. These methods are costly, their fuel is finite/nonrenewable and there are significant environmental impacts associated with the fuel’s extraction and use. Producing hydrogen through electrolysis using electricity generated by these methods would be prohibitively costly in many respects. However, given recent trends, it is conceivable that renewables such as wind and solar could reach a price point where renewable generation could be over-sized to negate the current inefficiency of hydrogen production through electrolysis. One could easily imagine wind farms or solar arrays being set up solely for the purpose of producing hydrogen.

Works Cited

Anscombe , N. (2012, June 4). Energy storage: Could Hydrogen be the Answer? Retrieved January 20, 2013, from Solar Novus Today: http://www.solarnovus.com/index.php?option=com_content&view=article&id=5028:energy-storage-could-hydrogen-be-the-answer&catid=38:application-tech-features&Itemid=246

Jacobson, M. Z., & Golden, D. M. (2004). Hydrogen Effects on Climate, Stratospheric Ozone, and Air Pollution. Menlo Park: Stanford University.

Romm , J. J. (2004). The hype about hydrogen : fact and fiction in the race to save the climate. Washington, DC: Island Press.

Verne, J. (1918). The Mysterious Island. New York: Simon & Schuster.

Zubrin, R. (2007). The Hydrogen Hoax. Retrieved from The New Atlantis: http://www.thenewatlantis.com/publications/the-hydrogen-hoax


Thursday, October 17, 2013

Thermal Energy Storage

With the possible exception of kinetically charged flywheels, energy storage technologies, discussed thus far, have used electricity as the primary form of energy to charge the storage device. In all cases the output of the storage device, during discharge, has been electricity. Other forms of energy can be the input and output of a storage device. In the case of thermal energy storage, the charging and sometimes discharging of the device involves the transfer of heat. Just like other storage technologies, there is great variability in energy storage metrics that characterize the device and the device’s application.
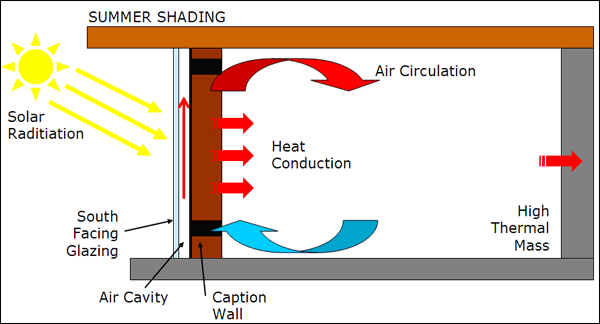
One form of thermal energy storage, common as a "passive design" practice for the built environment, is to add thermal mass onto a building to buffer indoor temperatures against dramatic shifts in outdoor temperature. Sometimes called a "thermal flywheel" because of its ability to smooth out temperature variation, thermal mass can have a dramatic impact on the amount of energy used to heat or cool a building. Thermal mass is simply a solid or liquid that will absorb and store warmth, often from direct sunlight, so that the heat can be released indoors when outdoor temperatures fall. Thermal mass implementations have also been used to store "coolness" by releasing heat to reach a lower temperature and then absorbing heat at a later time to reduce indoor temperatures relative to the warmer outside temperatures (Torcellini & Pless, 2004).  Figure 1 shows a diagram of a common thermal mass building element called a “Trombe wall”. A well installed Trombe wall can dramatically reduce the climate control energy needs of a building (DWLS, 2008).
  

 Figure 1 basic diagram of a Trombe wall used for thermal energy storage (DWLS, 2008).

Thermal energy storage can also be used to generate and store electricity. Concentrated solar thermal - CST - power plants use parabolic mirrors, called heliostats, which track the sun as it passes through the sky to concentrate sunlight. In some applications, a large array of two-axis heliostats concentrates the sunlight to a central point in the power plant to heat a generating fluid. In other applications the fluid is heated in a pipe located at the focal point of each single axis heliostat (Solúcar, 2006). Steam is generated, either directly, when water is the generating fluid, or indirectly, when other substances are used. This steam turns a steam turbine that powers a generator producing electricity. Some of the heated generating fluid is stored for later use. This allows the CST to compensate for variations in solar access caused by clouds while also providing the ability to produce power at night. Depending on the generating fluid and system design, the night time discharge duration can be several hours. Figure 2 shows a diagram of the PS-10, a 10MW solar thermal power plant located near Seville, Spain. The PS-10 uses water/steam as the generating fluid and has a storage capacity equivalent to 20 MWh (Solúcar, 2006).


Figure 2 showing a diagram of the PS-10, a 10MW thermal power plant near Seville, Spain, with a thermal storage capacity equivalent to 20 MWh (Solúcar, 2006).

Recently, the world’s largest parabolic trough Concentrated Solar Power plant with thermal energy storage, built in Gila Bend, Arizona, passed commercial operation tests. Though similar in some respects to the plant shown in Figure 2 this massive 280 MW facility uses parabolic mirrors to concentrate sunlight to a pipe containing a heat transfer fluid (synthetic oil) that passes through the focus of the parabolic mirror. Ultimately water is heated by the heat transfer fluid to become steam to drive a turbine. A reservoir of heated oil is used to store excess thermal energy. This stored thermal energy can be used to drive the turbines at full power (280 MW) for six hours (Owano, 2013).
In all but the coldest climates, energy used to provide air conditioning can represent a sizable portion of a building’s electricity consumption. Thermal energy storage, such as Ice Energy’s Ice Bear distributed thermal energy storage system, can be used to augment traditional air conditioners to make them more efficient. The Ice Bear is essentially a large thermal storage tank where ice is produced at night during off peak periods (Figure 3). This not only takes advantage of cheaper off peak energy, it also improves the overall efficiency of the system as nighttime temperatures are lower, requiring less energy to produce the ice. During peak daytime periods, when AC energy consumption is high, water chilled by the ice is used to cool the AC unit’s refrigerant instead of the unit’s compressor. The “discharge” cycle of the Ice Bear is at least 6 hours. The unit is also advertised as being a “lossless” storage system because the Ice Bear improves the operating efficiency of the AC unit to a point that “more than compensates for any inherent inefficiencies in the storage/discharge cycle common to other types of energy storage.” (Ice Energy, 2012) The Ice Bear is rated to provide a 7 kW reduction in peak power demand with a total of 35 kWh of energy shifted to off peak with a 25 year design life (Ice Energy, 2012).


Figure 3 showing Ice Energy’s Ice Bear thermal energy storage system used to augment an existing building AC unit (Ice Energy, 2012).

Works Cited

DWLS. (2008). Design Examples | Druk White Lotus School, Ladakh. Retrieved January 20, 2013, from www.dwls.org: http://www.dwls.org/Sustainable-Design-Examples.html

Ice Energy. (2012). Product Sheet; Ice Bear Energy Storage. Windsor, CO: Ice Energy.

Owano, N. (2013, October 11). Arizona solar plant achieves six hours after sun goes down. Retrieved October 17, 2013, from phys.org: http://phys.org/news/2013-10-arizona-solar-hours-sun.html

Solúcar. (2006). 10 MW Solar Thermal Power Plant for Southern Spain. Seville, Spain: Solúcar.

Torcellini , P., & Pless, S. (2004). Trombe Walls in Low-Energy Buildings: Practical Experiences. Golden, CO: National Renewable Energy Laboratory .


Wednesday, October 16, 2013

Flywheels

Flywheels represent a purely kinetic means of mechanical energy storage that leverages the rotational inertia embodied in a large spinning flywheel. Motors often spin the flywheel until they reach their operating angular velocity (Figure 1). At this point small amounts of energy are required to keep the flywheel spinning. To produce electricity the flywheel spins the motor (which now acts as a generator) until power is brought back into the flywheel or the flywheel stops spinning. Flywheels were historically characterized by massive wheels spinning on shafts physically connected to bearings. Traditionally they were prone to catastrophic, sometimes fatal failures with somewhat short term output. Modern flywheels feature more compact designs with greater capacity. They are constructed with compact composite rotors housed in vacuum enclosures, spinning on frictionless magnetic bearings (Figure 1) (Abele, Elkind, Intrator, & Washom, 2011). Despite the improvements in the safety and performance of a modern flywheel, they are still often covered with a protective shield designed to contain the unit in case of a failure.

Figure 1 showing a modern flywheel energy storage system (Molina, 2010)
Flywheels have been used for thousands of years to store energy. Some early examples include potter’s wheels, grinding stones and the large flywheels on steam engines. In all of these applications, the energy from variable or pulse sources of power is balanced to provide a continuous output using the inertia of the spinning mass of the flywheel. This steady or continuous nature of the output power make modern flywheels a natural fit for power quality applications and UPS applications (Abele, Elkind, Intrator, & Washom, 2011). The ability to charge using highly variable pulses of power, in the form of kinetic or electrical energy, makes flywheels an ideal candidate for regenerative power applications such as industrial cranes and light rail (Baxter, 2006).
Flywheels are tolerant of a wide range of environmental conditions and can be deeply (even completely) discharged over a large number of cycles. They are also characterized by a long service life with corporations producing flywheels offering product warranties in excess of 20 years. The power of a flywheel is directly related to the mass of the rotor; however the power increases to the square of the rotational surface speed of the rotor. For this reason modern flywheels have lighter composite rotors that spin at very high speeds, potentially up to 100,000 RPM, but more commonly in the range of 20,000 to 60,000 RPM (Baxter, 2006). With a direct connection between the motor/generator, lighter rotors, spinning at high speed, give flywheels a very fast response time that rivals that of batteries. These high speed rotors also make flywheels more appropriate for applications requiring short duration bursts of power. Individual flywheels can produce power in the 100kW range with a discharge duration measured in minutes. A common strategy is to combine a large number of flywheels to increase the power output. Flywheels are estimated to have a cost of $459/kW, however the life cycle costs of a flywheel can be very low (Baxter, 2006).
               The reliability, fast response times and low operating costs of flywheels make them very appealing; however the low discharge duration is considered a significant limitation of flywheel technology. This short discharge duration has the effect of limiting the applicability of flywheels to support renewable energy generation. For this reason recent research activities have centered on increasing the energy output of flywheels to allow them to be used for applications such as renewable firming, arbitrage or even load shifting. One example is the 2010 ARPA-E contract signed with Beacon Power (a Massachusetts based flywheel manufacturer) to develop long discharge duration flywheels with the goal of supporting renewable energy installations (GlobeNewswire, 2010). In the following year Beacon Power applied for bankruptcy protection, forcing Beacon Power to shift from a flywheel research and development role to a company that owns and operates flywheels to provide power quality applications to utilities. Recently, on September 11, 2013, Beacon Power began providing frequency regulation services to Pennsylvania’s PJM Interconnection with a flywheel energy storage plant currently rated at 4 MW. The plant is expected to be built out to reach a power rating of 20 MW by the second quarter of 2014 (Beacon Power, 2013). Though recent investment is clearly focused on power applications, it should be noted that other companies such as Temporal Power, in Ontario Canada, are continuing to innovate to develop flywheels that can be used for energy applications.

Works Cited

Abele, A., Elkind, E., Intrator, J., & Washom, B. (2011). 2020 Strategic Analysis of Energy Storage in California. Los Angeles: California Energy Commission. Publication Number: CEC-500-2011-047.

Baxter, R. (2006). Energy Storage; A Nontechnical Guide. Tulsa, Oklahoma: PennWell Corporation.

Beacon Power. (2013, September 18). Beacon Power LLC Begins Commercial Operation at Flywheel Energy Storage Plant in Pennsylvania. Retrieved October 16, 2013, from www.beaconpower.com: http://www.beaconpower.com/files/pr/Hazle4_MW_release_FINAL.pdf

GlobeNewswire. (2010, September 27). Beacon Power Signs ARPA-E Contract to Begin Developing Long-Duration Flywheel for Renewable Energy Integration. Retrieved January 25, 2013, from NASDAQ OMX, GlobeNewswire: http://globenewswire.com/news-release/2010/09/27/430303/202351/en/Beacon-Power-Signs-ARPA-E-Contract-to-Begin-Developing-Long-Duration-Flywheel-for-Renewable-Energy-Integration.html

Molina, M. G. (2010). Dynamic Modelling and Control Design of Advanced Energy Storage for Power System Applications. San Juan: Argentinean National Research Council for Science.